
The Essential Guide to
Leveraging AI as a CS Leader
Having the Courage to Embrace the Vision, Evolution, and Accomplish the Goals of Change with AI.
Chapter 1
Introduction of Artificial Intelligence in Customer Success
In the current business landscape, the infusion of Artificial Intelligence (AI) into Customer Success (CS) strategies represents an evolutionary shift. This transformation is not merely about consolidating new technologies. AI is a fuel for innovation.
As a force for change, AI is set to revolutionize how businesses, especially those in the Software as a Service (SaaS) sector, interact with their customers. This change in customer success is not on the horizon. It’s already here and gaining momentum rapidly.
According to a 2024 Forbes Advisor survey, 64% of respondents in SaaS believed that AI will “improve customer relations and increase productivity,” with 55% deploying AI for more “personalized services.” And that is just the beginning.
According to a recent Gartner report, companies deploying AI as a business tool are projected to surpass 60% by the end of 2024. These figures underscore the significant role AI is set to play in the future of SaaS and Customer Success.
For CS leaders, the path to harnessing AI is more than just a choice. It’s an imperative. It entails a paradigm shift that should harmonize technology with human-first empathy, data with insights, and automation with personalization. The integration of AI is not a question of if but when and how.
The Hyper Growth and Use of AI Technology
In the 2000s, before the advent of ChatGPT, AI in business was largely experimental, focusing on automating simple tasks through ‘basic’ machine learning. In the 2010s, AI’s role in business expanded beyond the realm of experts, with a shift towards community-based learning and end-user interaction.
By the 2020s, AI had firmly established itself in the business landscape. AI capabilities became more accessible to end users through natural Language Learning Models (LLMs). These LLMs have evolved so much that they can translate your intent into actions you want to perform. And the progress this technology is making is impressive.
With the introduction of OpenAI’s ChatGPT in 2023,, Artificial Intelligence officially moved from research labs to mainstream tech. Companies today have quickly begun to use it in everything from customer journey mapping to customer-centric content creation and personalized recommendations.
The widespread adoption of AI is not a fleeting trend. It has the power to fundamentally reshape business, including customer success strategies. As a result of AI’s development and growth, it has become instrumental in the areas of:
- Machine Learning
- Digital personal assistants
- Employee and customer education
- Internet research
- Data research and analytics
- Cybersecurity and data protection
- Customer Success, Customer Experience (CX), and Customer Relationship Management (CRM)
Gainsight CEO Nick Mehta is outspoken on the imperative of AI adoption to power your business and respond to today’s CS challenges.
“No matter who you are, we know that AI can make your job easier and better. On top of that, you can make better decisions with better insights about your client. What’s predictive of churn? How do you drive a better upsell or advocacy in your client base to help you do a better job with your customers? Spending less time on that annoying, mundane work that takes you away from your clients, your family, or folks outside of work. AI is going to radically make customers and customer success better. “
AI empowers customer success professionals to delve into unstructured and even unclean data, enabling them to detect patterns and identify risks. It can process vast datasets, anticipate customer needs, generate personalized communications based on simple instructions, and even predict churn with unprecedented accuracy. However, it can also provide a work-life balance by adding speed to workflows and freeing CS teams from busy work.
These capabilities mark a significant shift and evolutionary milestone in the role of AI from a tool for operational efficiency to a strategic asset for customer engagement and retention.
Chapter 2
The Value of AI Integration into CS
Contemporary customer expectations are continually developing and maturing, sometimes to the frustration of companies and business leaders. It’s as if, particularly in SaaS, there is a need to stay one step ahead of these expectations and the competition.
Driven by their experiences with B2C tools and growing expectations of technology, customers are seeking:
- Immediate responses to queries and requests
- Hyper-personalized interactions
- Proactive service triggered by unseen digital data acquirement and analytics
Meeting these demands in real-time is a challenge, but one that CS leaders and teams can overcome with the right tools. Artificial Intelligence, which can predict customer needs, automate routine tasks, and provide strategic insights, emerges as a powerful ally for customer-facing teams.
AI’s role in CS is multifaceted. It extends from automating customer interactions in value-added ways to harnessing predictive analytics. The analytics will aid companies in foreseeing customer challenges better before they escalate to churn risks.
In Gainsight’s State of AI in CS 2023, respondents already leveraging AI within their CS organizations shared that over 85% of Customer Success and Customer Support teams are “enthusiastically” embracing Generative AI. Additionally, 47% of those utilizing the benefits of AI believe that their teams will save time and drive efficiency through the automation of redundant tasks.
The benefits of integrating AI into CS strategies are more than just compelling. They are truly transformative. This technology empowers businesses to offer unparalleled customer experiences, detect customer churn risk earlier, and save internal time and resources with new efficiencies. Ultimately, AI and CS together foster loyalty, provide evidence of value, and drive growth, presenting exciting new opportunities for customer success teams.
Understanding AI’s Potential in CS
Before embarking on the implementation journey, CS leaders must first grasp the breadth and depth of AI’s potential. AI can automate repetitive tasks, provide personalized customer insights, and predict future customer behaviors through analytics.
It can also enhance how we understand information, and sort through the ‘noise’ of customer data and inputs. Denise Stankowski, Gainsight’s VP of Product Management, captured how AI can help lift the burden off of CS teams—from the individual contributor to the CS leader.
The huge opportunity Generative AI offers us is just giving us sanity out of that crazy noise of inputs. Not to tax our brains unnecessarily but to synthesize them. By doing little steps automatically, we can focus on what is really relevant…AI can take some of this burden off of us.
Today, generative AI within CS is already being used for:
- Technical assistance and troubleshooting without a significant drain on FTE hours
- Professional support with opportunities for early intervention and expansion
- Content creation and editing directed to particular segments or demographics
- Playbooks and use cases based on repeated customer behavioral issues elevated by AI
- Learning and education for employees and customers, preventing an overload on learning management, professional services, and support.
- Research, analysis, and decision-making by elevating, preventing, and predicting issues of customer usage.
By understanding AI’s capabilities, leaders can determine the most impactful applications of AI.
Embracing and Empowering AI: A Strategic Imperative for CS Leaders
For CS leaders, the integration of AI presents both opportunities and challenges. The opportunity lies in enhancing the efficiency and effectiveness of CS teams, thereby elevating the customer experience. However, the challenge is selecting the right AI tools, implementing them effectively, and ensuring they complement human empathy and relationship-building with customers rather than replacing them.
Blending AI into CS strategies successfully demands a nuanced understanding of both the technology and the distinct needs of your customer base and customer-facing teams. The strategic deployment of AI should revolve around addressing the top opportunities and pain points for these two groups. The technology you employ is not a barrier. It should ensure AI facilitates personalized, empathetic customer interactions.
The deployment of AI in customer success goes beyond operational efficiency and predictive analytics. It also encompasses creating engaging, interactive experiences that foster a deeper connection between the customer and the brand. Whether through personalized customer recommendations, interactive chat-like elements, or AI-driven content, the goal is to make every customer interaction memorable and meaningful. In that way, CS teams can deliver Human-First AI.
Still, the power of AI is only useful with control. This control comes with aligning your use of Artificial Intelligence with identified Customer Success objectives and outcomes.
Takeaways
More Customer Success teams and leaders are intent on leveraging Generative AI to unlock productivity and advance with new possibilities than ever before.
For CS leaders, the path forward involves not just understanding AI’s potential but mastering its integration into the fabric of customer success strategies.
As you explore and implement AI in customer success, it’s clear that the journey is as much about picking the right technology as it is about strategy, culture, and vision.
AI automation benefits saves time, promotes transparency, reveals challenges, and creates efficiency while transforming customer experiences.
CS can elevate customer experiences, drive loyalty, and propel businesses into a new era of growth, innovation, and achieved outcomes—if AI is implemented and used with best practices and proven strategies.
Chapter 3
Best Practices for Implementing AI Strategies
The journey of fusing Artificial Intelligence into Customer Success processes is indeed transformative. It provides the ability to redefine how businesses interact with their customers. However, the success of such initiatives hinges on the implementation strategy you choose to create.
When developing this implementation process, CS leaders and executives must pick strategic, achievable goals before selecting the right AI technology. To begin, identify the problems you are trying to solve and how they fit within your business and overall CS strategy.
Aligning AI with CS Objectives
AI has incredible potential when aligned strategically with CS functions. AI should compliment, not change, your existing customer programs. Clearly outline how AI will enhance customer experiences and achieve specific CS objectives, identifying key performance indicators (KPIs) that will be influenced by AI, such as:
- Customer satisfaction scores and NPS
- Response times or support ticket deflection
- Churn rate
- Time to first value
- Implementation time
- Cost to serve
You should also consider customer journey mapping to pinpoint where AI can have the most significant impact. Each CS team has unique customer pain points; this is where your leadership expertise comes in. Choose one area where AI can most effectively impact your business model, industry, and customer type. Your strategic decision in this regard is crucial for the success of our AI integration.
Selecting the Right AI Tools
With a plethora of AI tools available, selecting the right ones is critical. CS leaders should evaluate tools based on their ability to meet the business’s unique needs, integration capabilities with existing systems, and scalability. It’s also essential to assess the vendor’s thought leadership and support offerings to ensure smooth implementation and adoption.
Most critical is to ensure your chosen vendor has the proper security and privacy controls to protect your customer data when used with AI, particularly if and how that data will be used to train AI models. With many new AI startups and vendors entering the SaaS market, ensure you have confidence in the long-term viability of any chosen vendors.
Equally important is to avoid letting the excitement of AI result in unnecessary purchases of point solutions. Often, AI is embedded in tools that are already part of your workflows, providing the most value and helping provide the best inputs by consolidating your data in a few key systems.
Building a Skilled Team
Implementing AI in CS is not just a technological shift but also a cultural one. It requires building a team skilled in customer success principles and AI technologies. It might involve training existing staff, hiring new talent, or both. The goal is to create a team to bridge the gap between AI capabilities and CS goals.
At Gainsight, we’re setting the stage for a transformative shift within our organization with weekly co-working enablement sessions named “AI for ALL.” We are working to ensure every teammate is not just aware of but also comfortable and skilled in harnessing the power of AI. This initiative is rooted in a hands-on, experimental approach, where learning by doing becomes the cornerstone of our strategy.
By creating a culture that encourages curiosity and practical application, we are paving the way for our teammates to not only adopt AI technologies but to lead with them and, in so doing, also help lead our products toward the most powerful AI integrations.
Overcoming Challenges in AI Adoption
Adopting AI in CS operations comes with its set of challenges. They include data privacy concerns, resistance to change among staff, and the need for continuous learning and adaptation. Addressing these challenges requires transparent communication about the benefits and implications of AI, providing adequate training and support, and fostering a culture of innovation and adaptability.
Best Practices for AI Implementation
While it’s critical to filter these recommendations through the lens of your business and industry, consider the following best practices to get AI programs off the ground:
- Start Small and Scale: Begin with pilot projects to demonstrate value and gain insights before scaling AI across the CS function.
- Focus on Customer-Centric Outcomes: Ensure AI implementations are driven by a desire to improve customer experiences and outcomes. This is what true Human-first AI means for your customer-facing teams.
- Prioritize Data Quality: AI’s effectiveness is contingent on the quality of the data it analyzes. One Forbes report stated that “31% of businesses [are] expressing apprehensions about data security and privacy in the age of AI.” To address this concern, ensure that data management policies and practices are in place to maintain high-quality, relevant data.
- Ensure Transparency and Ethical Use: Be transparent with customers about how AI is used and ensure its application adheres to ethical guidelines, particularly concerning data privacy.
Best practices are not merely suggestions. They are the backbone of control. And with the real-time evolution of AI, businesses are understandably concerned about the quality of data and outcomes with its use, particularly in the context of AI-generated knowledge. The aforementioned Forbes report also highlighted these concerns, stating that “30% of survey respondents are concerned about AI-generated misinformation, while 24% worry that it may negatively impact customer relationships.” Using trusted technology providers with the right security and data checks on AI tools and use is key to alleviating customer concerns and ensuring value-add use of AI.
Measuring Success and Iterating
After implementation, it’s crucial to measure the impact of AI on CS objectives using the pre-defined KPIs. This evaluation should inform ongoing iterations and improvements, ensuring that AI tools meet evolving customer needs and business goals.
A key note on KPIs is that AI is constantly evolving. CS teams should consider both leading and lagging metrics to track their immediate progress and the long-term goals of using AI. Ensure your long-term goals account for the fast pace of innovation among AI tools and vendors.
Takeaways
Implementing AI within customer success is a journey marked by strategic planning, identifying challenges, careful tool selection, team building, and developing an AI policy of transparent usage.
AI will only reach its potential by adhering to best practices and fostering a culture of continuous improvement.
CS leaders can unlock the potential of AI only if a program aligns with prescribed goals and KPIs to measure progress.
The ultimate goal of your AI installation is to elevate the customer experience to new heights. Do not risk customers’ trust relationship using unverified or unchecked AI tools.
Going forward, we will explore real-world examples of AI integration in customer success, offering further insights and inspiration for CS leaders looking to embark on this journey.
Chapter 4
The Role of Human-First AI in Enhancing the Customer Journey
Merging artificial intelligence into customer success processes is a key opportunity for AI to impact the end customer’s experience and journey.
AI builds on the recent focus on digital customer success motions, helping CS teams scale human interaction and create new efficiencies in interacting and engaging with your customer base through digital channels. AI has emerged as a critical player in keeping these digital interactions personalized, leveraging customer data and objectives to surface content with extreme relevance to the customer.
The Shift Towards Personalized Customer Journeys
In the digital transformation era, customers no longer settle for slow responses. They crave fast, personalized interactions demonstrating a deep understanding of their unique preferences and brand history. In fact, according to a Zendesk CX Trends Report, for quick and immediate assistance, 51% of consumers prefer automated bot interactions over human ones. This is where AI steps in, offering businesses the tools to meet these evolving customer expectations.
AI stands at the forefront of this reformation, enabling businesses to analyze vast amounts of data and identify patterns that lead to highly personalized customer journeys—utilizing AI algorithms to predict customer preferences and needs based on past interactions, in-product behavior, and overall customer health. Businesses can now craft communications and recommendations at scale that still reflect their unique relationship with the end-user.
Enhancing Customer Service and Support with AI
How a business supports its customers in and outside a traditional customer support department is vital to the customer experience. AI has significantly elevated the effectiveness and efficiency of customer support by improving processing and, thus, the overall experience.
- AI-Powered Copilots and Virtual Assistants: These AI solutions are available 24/7, providing instant responses to user and customer queries, guiding them through troubleshooting steps, or escalating issues as necessary. By handling routine inquiries, they allow humans to focus on more complex customer needs.
- Sentiment Analysis for Emotional Intelligence: AI tools can analyze customer sentiment in real-time with contextual data. AI can draw associated sentiment from emails, reports, even call recordings, and other formats. The process enables businesses to better understand the emotional tone of customer interactions. This insight allows for more empathetic and tailored responses, whether automated or by human agents.
Customizing In-Product Recommendations
AI excels at analyzing customer data to make recommendations, significantly enhancing the customer experience. For businesses who collect usage and behavioral data along the customer’s journey, each touch point combined with AI reveals new information about what and where they were exploring. AI can aggregate and analyze usage data to reveal customer roadblocks and needs, key value features, and make recommendations on what to do next.
- Sophisticated Recommendation Engines: One of AI’s most impressive capabilities is its sophisticated recommendation engines. By comprehending a customer’s history and preferences, these engines can suggest a wide range of items, from next best features to self-serve content or value-added educational courses, that customers are more likely to find appealing. This motion significantly increases their ability to find relevant information and create stickier in-product experiences.
- Real-time Adjustments: These AI systems can adjust recommendations in real time based on customer interactions, ensuring that suggestions remain relevant even as customer interests shift.
- Natural Language Processing (NLP): AI can understand instructions like humans, using chat-like responses to build/configure programs or products per the user’s requirements. Because of the simple interactions required, engaging with and getting value from AI tools can be accessible and intuitive.
AI can help deliver personalized recommendations at scale, allowing customers to engage with more relevant content on their own and giving CS teams more time to focus on higher value, more strategic conversations with their customers. As AI supports interactions at scale, that same deep data analysis predicts more ways for human interaction to address deeper customer needs revealed in data.
Predictive Analytics for More Effective Human Engagement
AI’s predictive capabilities enable businesses to anticipate customer needs and potential issues before they arise, fostering a proactive human engagement strategy.
- Predicting Customer Needs: AI can identify when a customer is likely to need human support or if their usage indicates an opportunity for upsell or expansion, allowing businesses to reach out proactively with solutions or suggestions.
- Exposing Customer Gaps: AI exposes when a customer is not being touched by CS teams enough, signaling to CS leaders that a specific segment or customer is under-served. This proactive data analysis helps businesses more proactively engage earlier, before customers become churn risks.
- Churn Prediction and Prevention: By analyzing patterns in customer behavior, AI can better predict which customers are at risk of churning. This allows businesses to proactively engage these customers with personalized offers or support to retain them.
When considering how AI improves the customer journey and experience, Meenal Shukla, Senior Director of Customer Success at Gainsight, understands how AI compliments human customer success motions.
When you think about AI in the customer journey, the collaboration between CS and your product, as well as digital scale teams, is imperative. CS teams are the eyes and ears of the organization and can pay close attention to what your customers are saying and looking for from AI capabilities in their experiences. Look for opportunities where your product can bring AI to your customers and bring those recommendations back to your product team. The only way to ride this AI wave is to be nimble and responsive to your market.
Takeaways
The application of AI in enhancing customer experiences is not just a trend but a necessity in the digital age. It personalizes the customer journey and improves support through customized recommendations and predictive analytics.
AI equips businesses with the tools to meet and exceed customer expectations in previously unimaginable ways. Integrating AI into the customer experience lets CS teams focus on more strategic impacts, leveraging AI to still keep digital scale interactions personalized.
AI can undoubtedly enhance the customer journey, but it’s essential to effectively harnessing AI behind the scenes for customer success operations to drive true value.
Chapter 5
AI in Customer Success Operations
Efficiency is the mark of good Customer Success Operations effort. Still, CS Operations can get bogged down without the right tools that can enhance productivity or provide predictive capabilities. Without them, the ability to enhance customer engagement can fall short. Artificial Intelligence has been shown to improve CS operations in several ways.
Streamlining Operations with AI
The operational backbone of customer success teams involves managing numerous tasks, from onboarding new clients to ensuring the ongoing satisfaction of existing ones. AI tools automate and streamline these tasks, freeing up human agents to focus on more complex, value-added activities.
- Automated Customer Programs: AI-driven systems can guide new customers through specific journey stages, such as onboarding, acting as a personalized assistant and providing them with resources and checklists tailored to their specific needs and responses.
- Efficiency in Routine Tasks: By automating routine tasks such as scheduling meetings, sending follow-up emails, and updating customer records, AI becomes a valuable resource. It allows customer success managers to allocate more time to strategic planning and personalized customer engagement.
Enhancing Customer Data Analysis
Gathering and analyzing customer data is crucial for understanding and predicting customer behavior. AI significantly amplifies this capability, providing previously unattainable insights due to the sheer volume and complexity of the data.
- Deep Data Insights: AI tools can analyze vast datasets to identify trends, predict customer behavior, and uncover areas for improvement. This analysis includes everything from usage patterns to support tickets, meeting transcripts, and customer satisfaction survey feedback.
- Early Intervention for At-Risk Customers: Through predictive analytics, AI can pinpoint customers at risk of churning. Both Forrester Research and Bain and Company reported that companies using AI have experienced a 10-15% decrease in customer churn rates. With early AI prediction efforts, customer success teams step in early with personalized retention strategies, potentially saving valuable customer relationships.
- Real-time Monitoring and Alerts: AI systems are not just passive observers of customer data. They actively monitor it in real time, alerting customer success teams to potential issues or opportunities for engagement. For example, AI can provide intelligent alerts on company milestones such as M&A activity, using tools to scrape this data from multiple sources and proactively surface it for CS action. This proactive approach empowers companies to address concerns before they escalate and seize opportunities to improve customer relationships.
In the spirit of “garbage in, garbage out”, health scores are often only as good as the data and parameters that are set for them. AI Scorecards is one way AI can impact this core CS capability – leveraging a wide range of data points (historical renewal data, adoption data, survey response data, and cases) to deliver instant configuration recommendations that enhance the predictive power of scores, and the efficacy of each individual scorecard measure. AI can now enhance the reliability, efficiency, and strategic foresight scorecards can deliver for CS teams.
Personalized Customer Segmentation at Scale
One of the most significant advantages of AI in customer success is the ability to understand customers at scale. It is a difficult feat for human CS teams to accomplish manually, but technology is making it easier to understand which customers fit specific personas and better segment customers and users into relevant lists or tags. By utilizing AI analysis and other inputs, teams can better target customers at scale using AI-powered analysis to determine which programs fit each customer best.
There are two recommended AI strategies to accomplish this goal:
- Predictive Segmentation for Precision Targeting: By using AI to recommend segmentation of customers based on various criteria, AI enables customer success teams to better tailor their approach.
- Audience and Contact Record Refinement: AI excels at identifying correlated data, and can make recommendations to enrich data based on a large corpus of customer content. Enriching data allows CS teams to better target customers, enhancing records to incorporate more accurate titles, contact information, and names. This data can then be better incorporated into audiences for customer journey programs and digital outreach to improve the overall customer experience.
Takeaways
The role of AI in accelerating efficiency in customer success operations is profound. As routine, administrative tasks can be more and more automated, operations teams can focus more on delivering value at scale to support CSM motions.
AI can make data more valuable to CS teams, through enrichment, optimization, and continued refinement of health scores, contact information and customer sentiment.
In the next chapter, we will delve into the challenges of artificial intelligence, including some of the ethical considerations companies need to make regarding issues such as privacy and AI usage.
Chapter 6
Overcoming Challenges and Ethical Considerations
From optimizing scorecard measures to self-serve chatbot answers, AI affects many motions influencing customers. One of the most considerable challenges for businesses is not whether or not you use artificial intelligence. Instead, the issue is how AI is used and whether it is being done in a human-first, ethical way.
Issues such as data privacy, where AI systems may collect and process personal data without consent, bias in AI algorithms, which can lead to discriminatory outcomes, and the accuracy of AI outputs, where AI may hallucinate inaccurate answers, need to be addressed.
It can be unsettling to those concerned with artificial intelligence and its trustworthiness. According to a 2024 Deloitte survey, 22% of respondents reported AI elicited feelings of anxiety, fear, or confusion, and 30% reported feelings of uncertainty. However, by implementing policies with forethought and clarity, we can take the next responsible step in using AI in human-first ways. Let’s discuss the challenges of implementing AI in customer success and how to navigate them responsibly.
Navigating AI Implementation Challenges
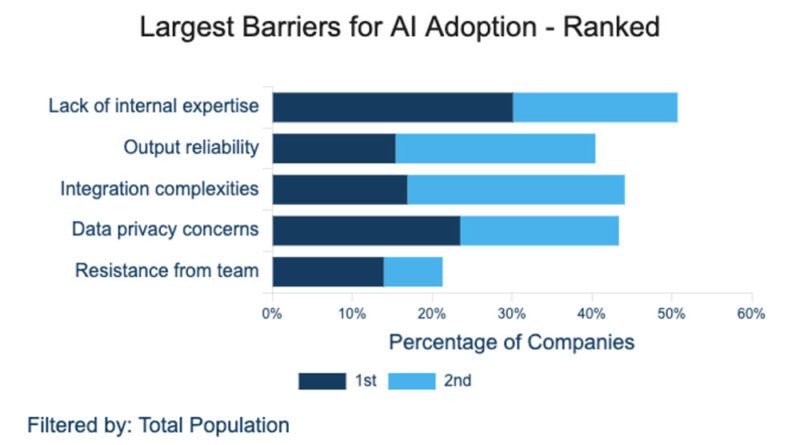
The path to AI integration can be challenging. CS leaders may encounter several obstacles, from technical issues to team resistance. In Gainsight’s recent State of AI in CS survey, respondents ranked a lack of internal expertise as the top barrier to AI adoption.
Here are key strategies to navigate these challenges:
- Technical Compatibility and Integration: Ensuring that AI solutions seamlessly integrate with existing systems is paramount. This often involves significant backend work and may require partnerships with IT departments or external vendors. However, the potential benefits of AI integration, such as increased efficiency and improved customer experience, should be a source of excitement and motivation. Using AI within an existing vendor may help overcome some of these technical challenges and create confidence in use of AI from an existing, trusted source.
- Data Quality and Quantity: AI’s effectiveness is directly tied to the quality and quantity of data available. Invest in data cleansing and enrichment processes and consider partnerships or third-party data providers if necessary. Establishing a robust data governance framework, which includes clear data ownership, data quality standards, and data access policies, will also ensure that data quality is maintained over time. Regular data audits and training on data handling can also be part of this framework.
- Change Management: Resistance from staff can be mitigated through effective change management strategies. Engage teams early in the decision-making process, highlight the benefits of AI for their daily tasks, and provide comprehensive training. Creating AI champions within teams, with individuals who are enthusiastic about AI and can influence their peers, can help foster a culture of acceptance and innovation.
- Skills Training: As AI continues to evolve, ensure training programs like those described in chapter 3 to create internal expertise and upskill the CS team that will be working with AI tools. Internal AI skills training will also nurture change management champions.
Ethical Considerations in AI Deployment
Ethical considerations become increasingly important as AI takes on more roles within CS strategies. Ensuring that AI is used responsibly involves addressing particular issues.
- Bias, Fairness, and Correctness: AI systems are only as unbiased as the data they are trained on. Proactively identify and eliminate biases in your data sets. Regularly review AI decisions for fairness, accuracy, and correctness to avoid AI hallucinations, especially in critical areas like customer segmentation and service level determinations.
- Transparency and Accountability: Customers and staff should understand how and why AI is used. This includes disclosing the use of AI in customer interactions and being transparent about how decisions are made. Establishing accountability mechanisms for AI decisions is also crucial, ensuring a straightforward process for addressing any issues that arise.
- Privacy and Security: AI systems often process vast amounts of personal data, raising significant privacy and security concerns. Strict adherence to data protection regulations, such as the General Data Protection Regulation (GDPR) in Europe or the California Consumer Privacy Act (CCPA )in California, is necessary to combat concerns. Ensure AI vendors have dedicated AI security measures in place, such as a Trust Layer, to ensure sensitive customer data is not used to train LLMs or made accessible to cross-tenant users.
Cultivating an Ethical AI Culture
Building an ethical AI culture within your organization is essential to successfully navigating the ethical landscape. To ensure that laws, policies, and intentions are followed, companies must follow through on fostering a healthy AI culture.
- Set Clear Ethical Use AI Guidelines: Developing and enforcing clear guidelines on the ethical use of AI is a good step, but it may have some limitations. As a company, you should set policies covering data handling practices, privacy, bias mitigation, and other related issues. Regularly update these guidelines to reflect new insights and regulatory changes.
- Ongoing Ethics Training: Providing ongoing training for your team on ethical AI use is necessary for its success. Such efforts should include recognizing accuracy of sourced content and understanding privacy implications. Check your sources and facts.
Open Dialogue with Stakeholders: Engage with customers, employees, and other stakeholders about your use of AI. This open dialogue can provide valuable insights into ethical concerns and help build trust in your AI initiatives. Lead with policies and leadership as models and encourage ethical decision-making and practices at all levels of the organization. Make security measures and data processing facts available to customers to add transparency on how AI is used for your business.
Takeaways
Successfully integrating AI into CS strategies requires navigating operational challenges and ethical considerations.
By adopting a thoughtful approach that prioritizes compatibility, data integrity, change management, and ethical guidelines, CS leaders can harness the power of AI to enhance customer experiences while maintaining trust and accountability.
The AI journey is complex, but the rewards for customers and companies can be substantial with the right strategies.
Chapter 7
The Future of AI in Customer Success
Customer Success is growing and evolving at a rapid pace. It elevates issues that some may not have considered, and it reveals opportunities for potential benefits. With so many advancements driven mainly by Artificial Intelligence, the future trajectory of AI in CS is promising. Anticipating change is never easy, but we can read the landscape and take control by proactively listening to the experts regarding direction and advancements.
Opportunities for CS Leaders
Advancements in AI are spreading across all facets of SaaS business. It offers a wealth of opportunities for CS leaders to elevate their strategies and capabilities and provide more value back to the business in today’s SaaS market.
- Practical Benefits of Enhanced Customer Insights: The depth and breadth of insights available through AI will inform CS strategies and drive product development and marketing approaches, empowering CS leaders to understand their customer base on a deeper level.
- Advantages of Increased Efficiency and Scalability: AI-driven automation will handle routine inquiries and tasks and free up CS teams to focus on complex issues and strategic initiatives. This shift will bring operational excellence and efficiency to the organization and enable scalability without proportional increases in team size, giving CS leaders a strategic and operational edge.
- Strategic Differentiation: Using sophisticated AI tools is not just a technological advancement but a strategic advantage that can set companies apart in competitive markets. CS leaders who are early adopters of emerging AI technologies can prove out the value of their CS team, establishing CS’ seat at the table as a key driver of business revenue and growth. Particularly as AI enhances product’s ability to build new features and functions, an optimized customer experience can set businesses apart as feature moats across SaaS shrink.
Meenal Shukla, Senior Director of Customer Success at Gainsight, summarized the opportunities of AI in a “success for all” manner. “AI can create opportunities to accurately show how connected your CS teams are with the customer, where risk exists across your portfolio, and what are key customer needs,” she explained. “By using those insights, you can coach your team better and also bring that cross-functional accountability to other teams where the customer journey is broken.”
Preparing for the Future
Technology is unveiling changes to the digital reality we create daily. While these changes may seem daunting, we cannot ignore or deny their existence. To fully harness the potential of AI in the future of CS, leaders must start preparing now with realistic goals and a focus on the myriad of beneficial possibilities AI integration can bring.
- Invest in AI Skills and Literacy: The role of leaders in building AI skills within CS teams is vital and will become increasingly important. This includes technical skills for managing AI tools and analytical skills for interpreting AI-generated insights.
- Stay Informed on AI Developments: The field of AI is evolving rapidly. Our leaders are responsible for staying informed about the latest developments through ongoing education and engagement with the AI community. This proactive approach will be crucial for leveraging new technologies as they emerge.
- Ethical AI Use: As AI capabilities expand, so do ethical considerations. Future-proofing AI strategies involve adhering to moral business standards and anticipating ethical debates and data privacy needs.
Takeaways
The future of AI in Customer Success is bright and filled with possibilities for innovation, efficiency, and enhanced customer engagement.
CS leaders have a consequential responsibility to anticipate technological advancements, seize the opportunities they present, and prepare for the challenges ahead. To accomplish this task, teams should be positioned along with the entire company at the forefront of the customer experience revolution.
The journey toward AI-driven customer success will be ongoing. One must stay ahead of the curve. The strategies outlined in this book provide a solid foundation for any CS leader ready to embrace the future.
Chapter 8
Conclusion: Leveraging AI for Transformative Customer Success
AI is revolutionizing every part of technology, SaaS, and customer success, empowering CS leaders with unprecedented ways to engage customers, streamline operations, and drive growth. By leveraging predictive analytics and natural language processing, AI enables CS teams to offer personalized, proactive services that were once out of reach. This transformation requires CS leaders to innovate, challenge the status quo, and foster a culture of continuous learning and ethical practice that inspires them to do so.
The journey toward AI-driven customer success requires energy and a thoughtful and responsible approach. It promises a future where data and innovation drive enhanced customer relationships and business growth. The potential for AI to reshape customer success is limitless, but it’s crucial to approach its implementation with caution and responsibility.